How Odds and Probability Are Calculated

Learn how odds and probability are calculated, including formulas, examples, odds-to-probability conversions, and common mistakes.
How odds and probability are calculated may seem complicated at first, but the basic math is quite manageable.
You see probability when a weather forecast gives a chance of rain, when a doctor discusses possible outcomes, or when you compare uncertain choices.
Odds are another way of describing the relationship between an event happening and not happening.
For instance, someone searching for hargatoto (Toto price) may come across odds while researching a chance-based activity.
However, the mathematics behind odds applies much more broadly.
Knowing the difference between probability and odds is important because the two terms are related, but they are not the same thing.
Once you understand how each is calculated, numbers that once looked confusing become much easier to interpret.
What Is Probability?
Probability measures how likely an event is to happen.
It is usually expressed as a number between 0 and 1, or as a percentage between 0% and 100%.
NIST describes probability as a measure of how likely an event is to occur, with 0 representing impossibility and 1 representing certainty.
For equally likely outcomes, the basic formula is:
Probability = Favorable outcomes ÷ Total possible outcomes
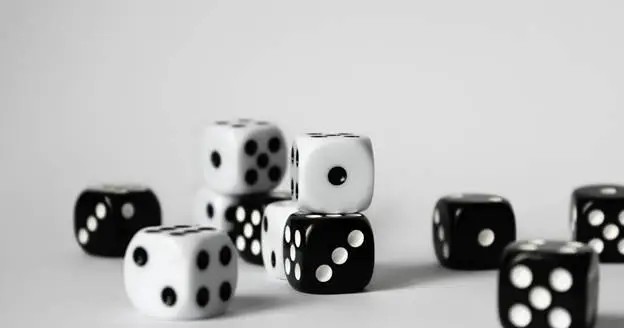
For example, a fair six-sided die has six possible results.
If you want to know the probability of rolling a 4:
1 ÷ 6 = 0.1667
That is about 16.67%.
OpenStax uses the same basic formula for theoretical probability when all outcomes are equally likely.
What Are Odds?
Odds compare the chance that something will happen with the chance that it will not happen.
Suppose an event has a probability of 60%.
The probability that it will not happen is:
100% − 60% = 40%
The odds in favor are therefore:
60:40
Simplifying the ratio gives:
3:2
So the odds are 3 to 2 in favor of the event.
This is an important distinction:
- Probability: 60%
- Odds: 3:2
They describe the same situation in different ways.
OpenStax defines odds in favor as the ratio of the probability of an event to the probability of its complement.
How Odds and Probability Are Calculated
How odds and probability are calculated depends on which value you already have.
Converting Probability to Odds
If you know the probability, use:
Odds in favor = P ÷ (1 − P)
Suppose the probability is 75%.
Convert 75% to a decimal:
P = 0.75
Then:
0.75 ÷ 0.25 = 3
So the odds in favor are:
3:1
This means there are three parts representing the event happening for every one part representing it not happening.
Converting Odds to Probability

You can also work in the opposite direction.
If the odds in favor are 3:1, add the two sides:
3 + 1 = 4
Then divide the favorable side by the total:
3 ÷ 4 = 0.75
So:
Probability = 75%
The general formula is:
Probability = A ÷ (A + B)
when the odds in favor are A:B.
OpenStax provides this conversion formula and examples of converting both probability to odds and odds to probability.
A Simple Real-Life Example
Imagine a box contains 10 equally likely tickets.
- 4 are blue.
- 6 are red.
The probability of selecting a blue ticket is:
4 ÷ 10 = 40%
The probability of selecting a red ticket is:
6 ÷ 10 = 60%
The odds in favor of blue are:
4:6
Simplify that:
2:3
So you have:
Probability = 40%
Odds = 2:3
The calculation changes depending on whether you are expressing the chance as a percentage or as a ratio.
Odds Against an Event
You may also see odds against an event.
Using the same example:
- Blue = 4
- Red = 6
The odds against selecting blue are:
6:4
Simplify:
3:2
So:
- Odds in favor of blue = 2:3
- Odds against blue = 3:2
OpenStax distinguishes between odds for an event and odds against an event using these complementary probabilities.
Why Independent Events Matter
Calculating more than one event requires extra care.
Suppose you toss a fair coin twice and want the probability of getting heads both times.
The probability of heads on the first toss is:
1/2
The probability of heads on the second toss is also:
1/2
Because the tosses are independent:
1/2 × 1/2 = 1/4
So the probability is 25%.
For independent events, the multiplication rule can be used to calculate the probability that both events occur.
This matters when people look at sequences of outcomes and assume that previous results automatically change the next result.
They do not when the events are genuinely independent.
Common Mistakes With Odds and Probability
A few mistakes appear regularly.
Mistake 1: Treating odds as percentages
Odds of 3:1 do not mean 3%.
If those are odds in favor, the corresponding probability is:
3 ÷ (3 + 1) = 75%
Mistake 2: Forgetting the opposite outcome
To calculate odds, you need both sides:
Event happens vs. event does not happen.
Mistake 3: Assuming probability guarantees an outcome
A probability of 80% does not guarantee that something will happen.
It means the event has an estimated probability of 0.80 under the model or assumptions being used.
Mistake 4: Ignoring the underlying assumptions
The basic favorable-outcomes formula works directly when outcomes are equally likely.
More complicated situations may require conditional probability, empirical data, or other statistical methods.
Why Understanding the Difference Matters
How odds and probability are calculated is not just a math exercise.
The difference affects how you interpret information.
When you see a probability, ask:
“Out of all possible outcomes, how likely is this one?”
When you see odds, ask:
“How does the chance of this event compare with the chance that it does not happen?”
Those two questions point to different ways of expressing uncertainty.
Conclusion
How odds and probability are calculated becomes much easier once you remember the relationship between them.
Probability measures the likelihood of an event.
Odds compare the likelihood of the event with the likelihood of it not happening.
The key formulas are:
- Probability = favorable outcomes ÷ total outcomes
- Odds in favor = P ÷ (1 − P)
- Probability from odds A:B = A ÷ (A + B)
These formulas can help you interpret statistics, risk, research findings, and other situations where outcomes are uncertain.
The numbers may look different, but once you know what they represent, the relationship becomes much easier to understand.